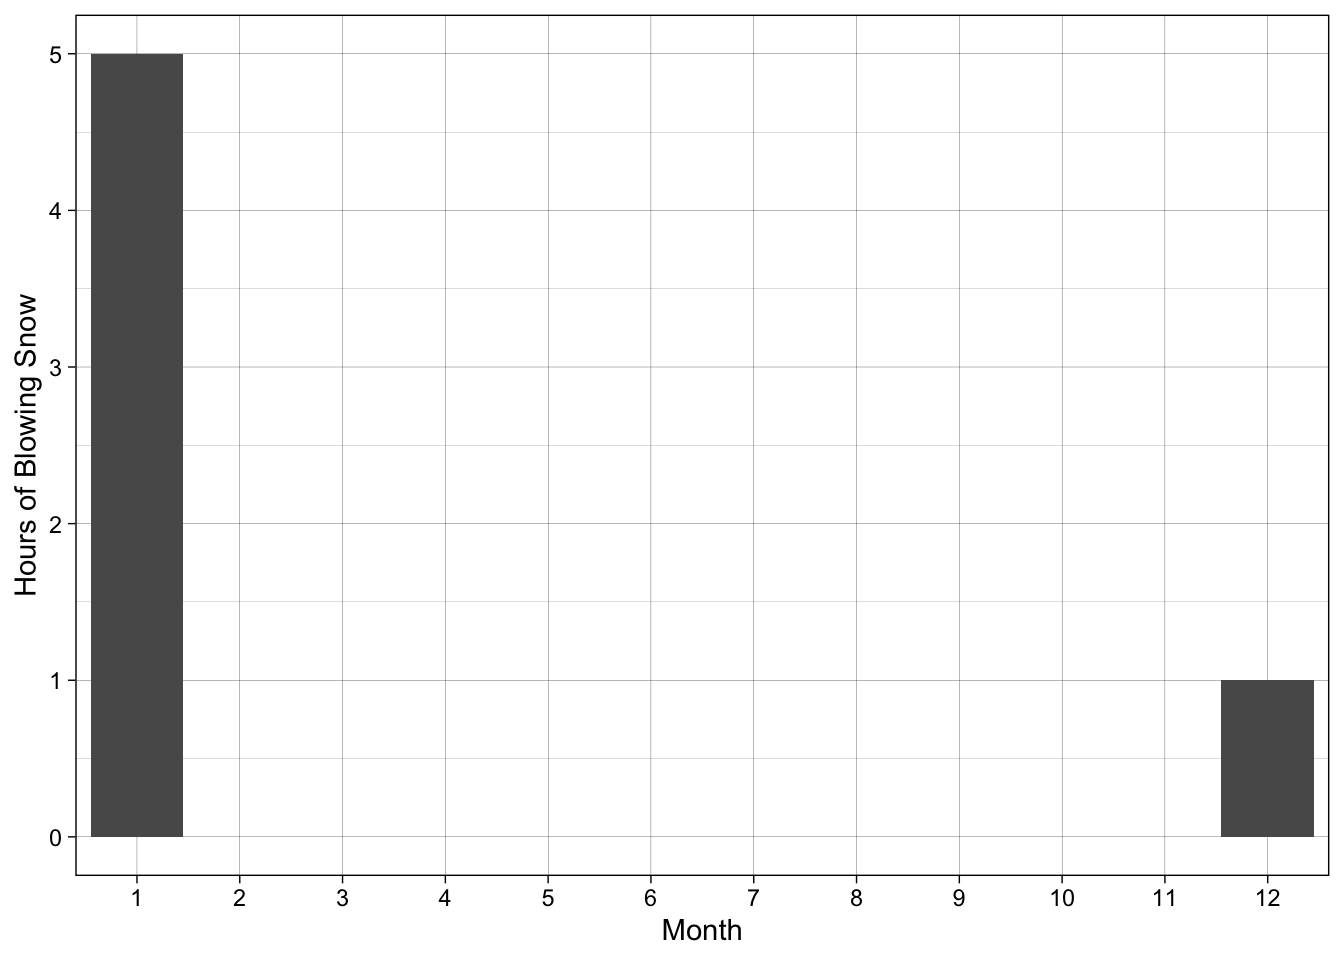
To begin analysis on the registration at Yellowstone National Park ASOS station, I first used the Li and Pomeroy 1997a equation (eq 1) to calculate the U10 threshold windspeed that was directly related to temperature. The next step was to create a statement that asked if the windspeed was above the U10 threshold and then to state the snow was blowing. After this, I ran a count function to determine the number of hours that snow was blowing, and this was summarized with a bar plot (figure 1).
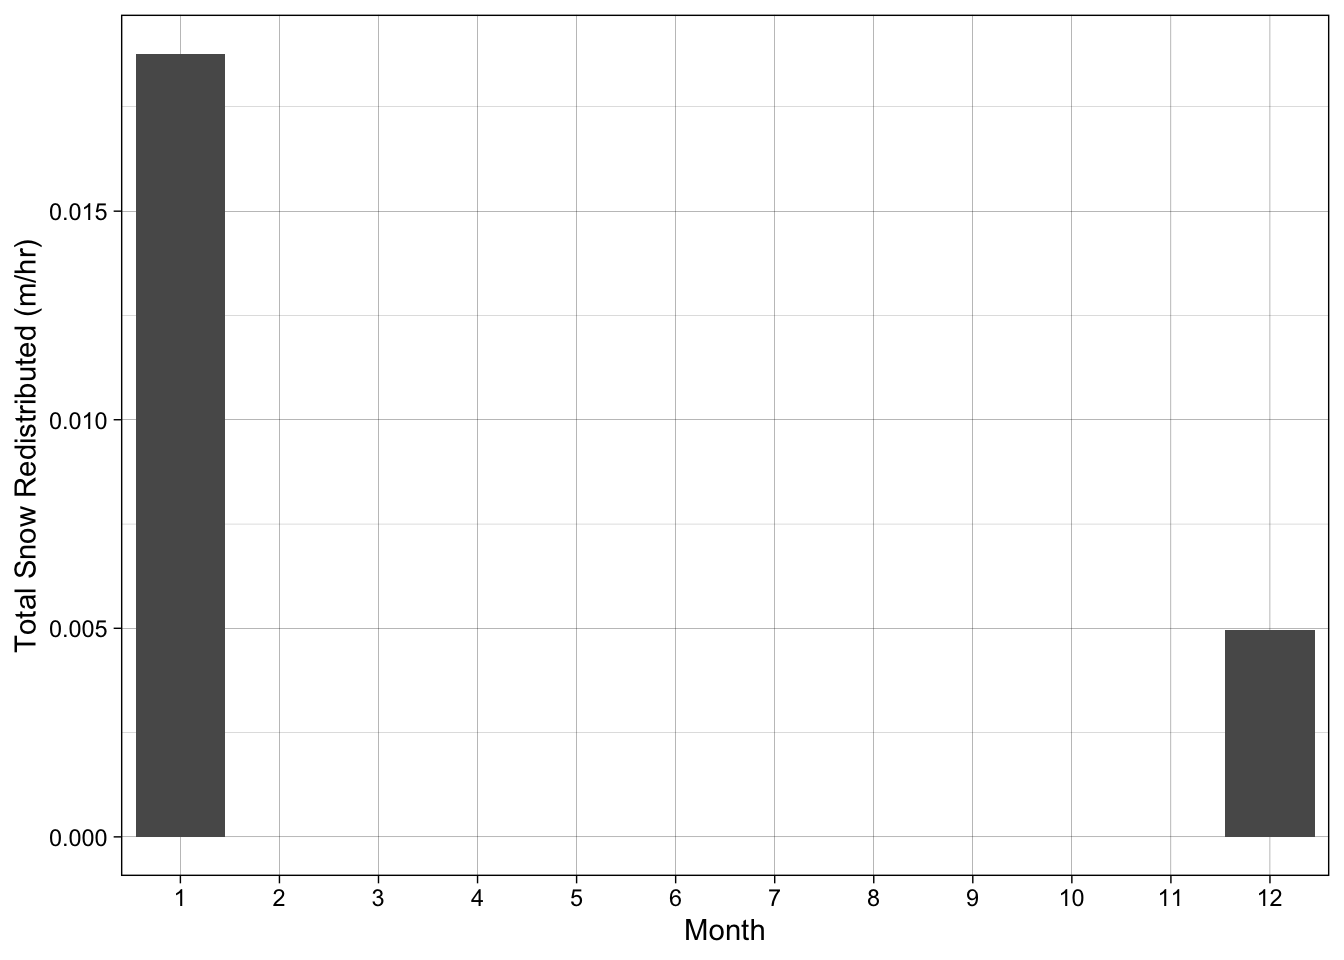
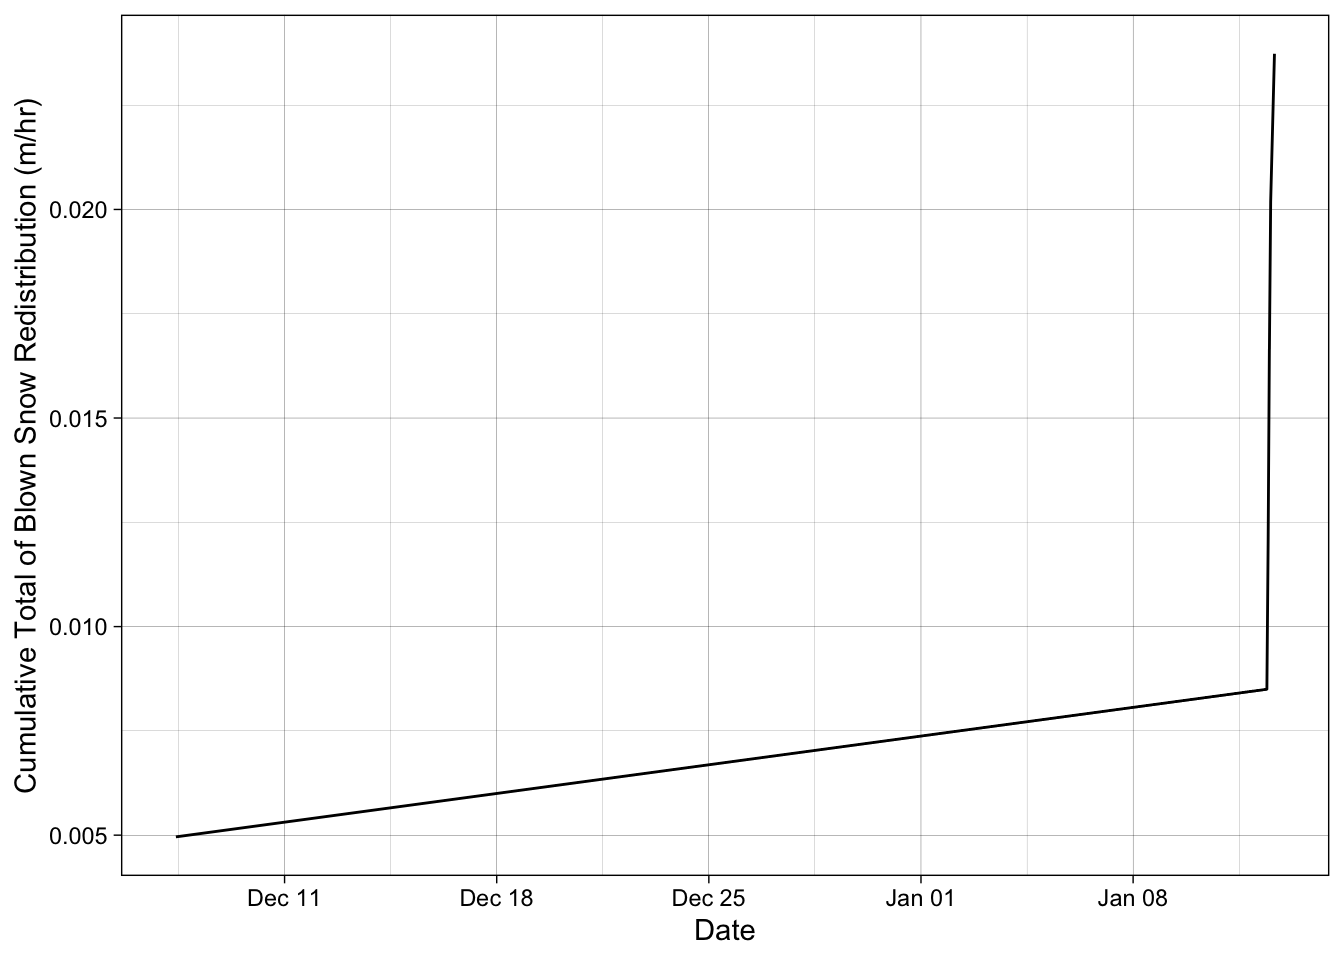
The next step in this project was to determine how much snow was blown around. I used the Pomeroy et al. 1991 equation (eq 2) that calculates the total snow transported. We had to multiply this value by 3.6 due to the conversion factor to get the results into meters/hr. With this quantity, I was able to calculate the cumulative sum of blowing snow and plot this over the year (Figures 2 & 3).
Equations
1. Uthreshold = 9.43 + 0.18 Ta = 0.0033 Ta2
2. Qt = 0.0000022 U104.04
Results
Yellowstone National Park accounted for six total hours of blowing snow based on the U10 threshold. This threshold averaged 9.2 m/s throughout the year. The average wind speed throughout the year at 2 meters, which was recorded from the ASOS station, was only 0.96 m/s. This site doesn’t receive much wind, resulting in only 6 hours of strong enough wind to move snow (figure 1).
Figure 1. Bar plot showing the number of hours that snow was considered blowing based on the U10 threshold from Li and Pomeroy 1997a.
Using those 6 hours of blowing snow, we calculated the total amount of transported snow through distribution as a function of wind speed. This resulted in only 0.024 m/hr of snow being blown (figure 2).
Figure 2. Bar plot showing the total quantity of snow that was redistributed using the Pomeroy et al. 1991 equation (eq 2)
Figure 3. Line plot showing the total cumulative snow throughout the year in Yellowstone National Park based on the Pomeroy et al. 1991 equation (eq 2).
Discussion
The result that came from this analysis showed that only 5 hours of data had strong enough wind to move snow. This seems very low, but when looking at the data that was recorded at the ASOS station, we can see that the average is very low, only averaging 0.96 m/s of wind speed. When the U10 threshold averaged a value close to 10 m/s, we can assume that this event did not occur very many times.
The total amount of snow that was transported due to these wind events was also very low. With the correction of m/hr, we only see a total of 0.024 m/hr of snow moved. When we convert this back into something that is more relatable, we have 2.4 mm/hr of snow blowing. This value is still small, but with the average wind speed being so low, we don’t expect much snow to be redistributed. This station doesn’t appear to be a windy location so perhaps this is the total quantity of snow transported. I find this unlikely, but the features around this ASOS station are unknown and may have an impact on the recording of windspeed at this site.
Code
Load in the Packages
source("Setup_WR574 copy.R")
── Attaching core tidyverse packages ──────────────────────── tidyverse 2.0.0 ──
✔ dplyr     1.1.4     ✔ readr     2.1.4
✔ forcats   1.0.0     ✔ stringr   1.5.1
✔ ggplot2   3.5.2     ✔ tibble    3.2.1
✔ lubridate 1.9.3     ✔ tidyr     1.3.1
✔ purrr     1.0.4
── Conflicts ────────────────────────────────────────── tidyverse_conflicts() ──
✖ dplyr::filter() masks stats::filter()
✖ dplyr::lag()    masks stats::lag()
ℹ Use the conflicted package (<http://conflicted.r-lib.org/>) to force all conflicts to become errors
Linking to GEOS 3.10.2, GDAL 3.4.2, PROJ 8.2.1; sf_use_s2() is TRUE

terra 1.7.65


Attaching package: 'terra'


The following object is masked from 'package:tidyr':

    extract


To enable caching of data, set `options(tigris_use_cache = TRUE)`
in your R script or .Rprofile.


Attaching package: 'tigris'


The following object is masked from 'package:terra':

    blocks


elevatr v0.99.0 NOTE: Version 0.99.0 of 'elevatr' uses 'sf' and 'terra'.  Use
of the 'sp', 'raster', and underlying 'rgdal' packages by 'elevatr' is being
deprecated; however, get_elev_raster continues to return a RasterLayer.  This
will be dropped in future versions, so please plan accordingly.
Load in the data
# Soda Butte Cr at Park Boundary at Silver Gate (06187915)sitenumber <-"06187915"parametercd <-c("00060", "00010")startdate <-"2023-09-01"enddate <-"2024-08-31"rawUSGSdata <-readNWISdv(sitenumber, parametercd, startdate, enddate)
# ASOS RAMOS YellowstoneASOS_yellowstone_original <-read_csv("DataIn/P60.csv")
Warning: One or more parsing issues, call `problems()` on your data frame for details,
e.g.:
  dat <- vroom(...)
  problems(dat)
Rows: 7370 Columns: 33
── Column specification ────────────────────────────────────────────────────────
Delimiter: ","
chr  (24): station, drct, sknt, mslp, vsby, gust, skyc1, skyc2, skyc3, skyc4...
dbl   (8): lon, lat, elevation, tmpf, dwpf, relh, p01i, alti
dttm  (1): valid

ℹ Use `spec()` to retrieve the full column specification for this data.
ℹ Specify the column types or set `show_col_types = FALSE` to quiet this message.
ASOS_clean <-read_csv("DataOut/ASOS_clean.csv")
Rows: 246 Columns: 9
── Column specification ────────────────────────────────────────────────────────
Delimiter: ","
dbl  (8): tmpf, p01i, relh, sknt, tmp_c, Td, P_mm, cumm_prec
dttm (1): valid

ℹ Use `spec()` to retrieve the full column specification for this data.
ℹ Specify the column types or set `show_col_types = FALSE` to quiet this message.
Rows: 246 Columns: 13
── Column specification ────────────────────────────────────────────────────────
Delimiter: ","
chr   (1): month
dbl  (11): tmpf, p01i, relh, sknt, tmp_c, Td, P_mm, cumm_prec, HP_fresh_snow...
dttm  (1): valid

ℹ Use `spec()` to retrieve the full column specification for this data.
ℹ Specify the column types or set `show_col_types = FALSE` to quiet this message.
Rows: 341 Columns: 10
── Column specification ────────────────────────────────────────────────────────
Delimiter: ","
chr (1): Date
dbl (8): Site Id, WTEQ.I-1 (in), PREC.I-1 (in), TOBS.I-1 (degC), TMAX.D-1 (d...
lgl (1): Time

ℹ Use `spec()` to retrieve the full column specification for this data.
ℹ Specify the column types or set `show_col_types = FALSE` to quiet this message.
Rows: 341 Columns: 13
── Column specification ────────────────────────────────────────────────────────
Delimiter: ","
dbl  (11): Site Id, WTEQ.I-1 (in), PREC.I-1 (in), TOBS.I-1 (degC), TMAX.D-1 ...
lgl   (1): Time
date  (1): Date

ℹ Use `spec()` to retrieve the full column specification for this data.
ℹ Specify the column types or set `show_col_types = FALSE` to quiet this message.
Methods.
Redistribution: Compute the occurrence and quantity of blowing snow:
Using a threshold wind speed based solely on temperature, determine the monthly frequency of blowing snow. Plot the monthly bar chart of the occurrence of redistribution.
Question 1
Monthly Frequency of blowing snow # You need to use the threshold sand say if the tempature is at this then see if the U10 is above that threshold.
Using the Pomeroy et al. (1991) total transport equation, estimate the cumulative hourly total quantity of blowing snow. Note that snow is only moved when the threshold wind speed is met or exceeded. Plot the cumulative hourly redistribution loss.